How up is up? [Bryan Fuller/Patrick Barron]
In the last spring football bits, and then in the podcast, I mentioned that I’d pulled the sophomore/redshirt freshman stats of a couple decades of quarterbacks we know in order to put our two 2016 signal-callers’ 2017s in perspective. I figure I should show that work.
I was trying to answer two questions: where did Peters/Patterson rank among other QBs their age, and what’s a standard progression for a guy who started his second year upon entering his third?
1. Shea and Brandon vs Other 2nd year QBs
Bless Foxsports.com for keeping sack stats with quarterbacks. I wish I’d taken rushing stats too but alas I only grabbed the passing stuff.
There’s going to be a lot of noise in here so a few things as you peruse:
- Some of the weirder results were low sample sizes. I only counted 100 or more attempts, so like Tate Forcier 2010 didn’t make the cut and Peters just did barely. Still I shaded in red a few to beware.
- I have them ranked by “Efficiency Percentile,” a junk stat I made up that’s 49% sack-adjusted yards per attempt, 23% each touchdown and interception rate, and 5% completion rating, normalized as a percentile among all the QB seasons (about 500 of them) I grabbed. The QBs are Big Ten mostly plus ND and Stanford guys Harbaugh coached. Kenpom Christmas colors apply: green is good, red is bad.
- I also showed completion %, sack rate, and college quarterback ratings, though they’re not included in the rankings.
The Kizer comp for Patterson is pretty close—I’m hesitant to give him Russell Wilson because Wilson had an extremely low interception rate, a trait which seems to presage NFL success. Shea…does not. The good news is the sack rate is correlated with so many things it’s impossible to say if Shea’s higher than normal rate of going down behind the line was indicative of anything. Sometimes it’s just a bad OL.
It was very possible for two QBs on the same team to have dramatically different sack rates. But the stat doesn’t give the reason. Sometimes that really was about poise:
Sometimes however it’s about which part of the schedule you got:
And sometimes it’s completely counter-intuitive:
Other than Denard most running QBs had high sack rates like Shea’s. I can’t tell you why—maybe those guys try escaping instead of throwing it away when under pressure, or maybe being part of the run game gets them sacked because of play-action. The highest sack rating I tracked was Braxton Miller in 2011. Two of the top four are notoriously stoic T.J. Ostrander seasons, and two more in the top ten are 2007 Notre Dame (bad OL). It’s too much to unpack.
[Hit THE JUMP for the Peters projection]
-----------------------------
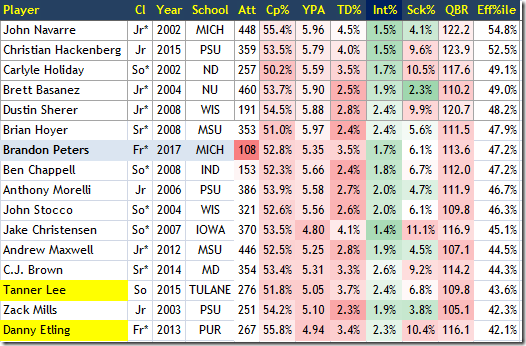
As for Peters—and warning: low sample—he was not at the bottom but certainly in the mediocre range of guys his age.
T.C. Ostrander in 2004 (two years before Harbaugh) is the nearest comp except for that afore mentioned sack rate, since both were averse to interceptions. Tanner Lee’s year at Tulane, and Danny Etling at Purdue were a few other similar players at his age. However neither of those guys were as efficient as our guy. Expanding that to any class here are some quarterback seasons similar to last year with Peters:
Some duds in there but also plenty of “don’t give up on that guy!” Brian Hoyer had an NFL career after that. The reaction most got was “eh, fine,” unless it was coming from Penn State fans.
We might as well swing back to Patterson then.
You’d take any of those seasons.
----------------------------
Question 2: What’s a Standard Year 2-3 Progression?
My sample wasn’t really large enough to get good read on this because I would need a much larger sample. There were only 39 quarterbacks I pulled data for who had 100+ attempts in both their 2nd and 3rd season. A median improvement in my efficiency stat was +5%, but that could vary from +22% (Carlyle Holiday) to –17.7% (JT Barrett).
bliggering it makes it clicker
Red means they got worse, green means they got that much better. Shea would be starting between Kizer and Russell Wilson and peaking over the 70% line. Peters would starting next to Juice Williams, and a standard progression should see him get over the 50% line.
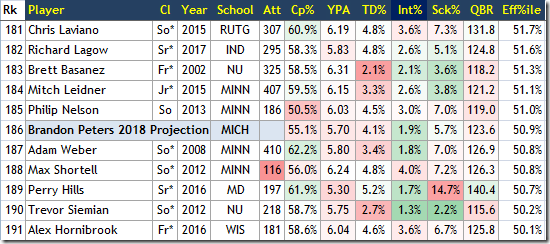
To make my projections I used the median percent change in each stat from this tiny sample and applied that to the sophomore/RS freshman seasons of Patterson and Peters. This is fraught with problems, for example INT rates generally went up with a rise in attempts and YPA. Is that a bad sample thing or is it 3rd year quarterbacks trying to do more?
Anyway the very salt-requiring standard progression should put Patterson just outside the top 25 best QB seasons in my study and Peters a bit below the middle.
Projected Shea would be in pretty strong company:
Projected Peters not so much:
I couldn’t include Brian Lewerke because of his freshman sample size, but he was another good comp for Peters. These guys don’t suck; they’re slightly below average starting quarterbacks. Patterson’s projection is more like “pretty good,” and getting into all-conference in a down year.
If you want the whole list it’s here:


